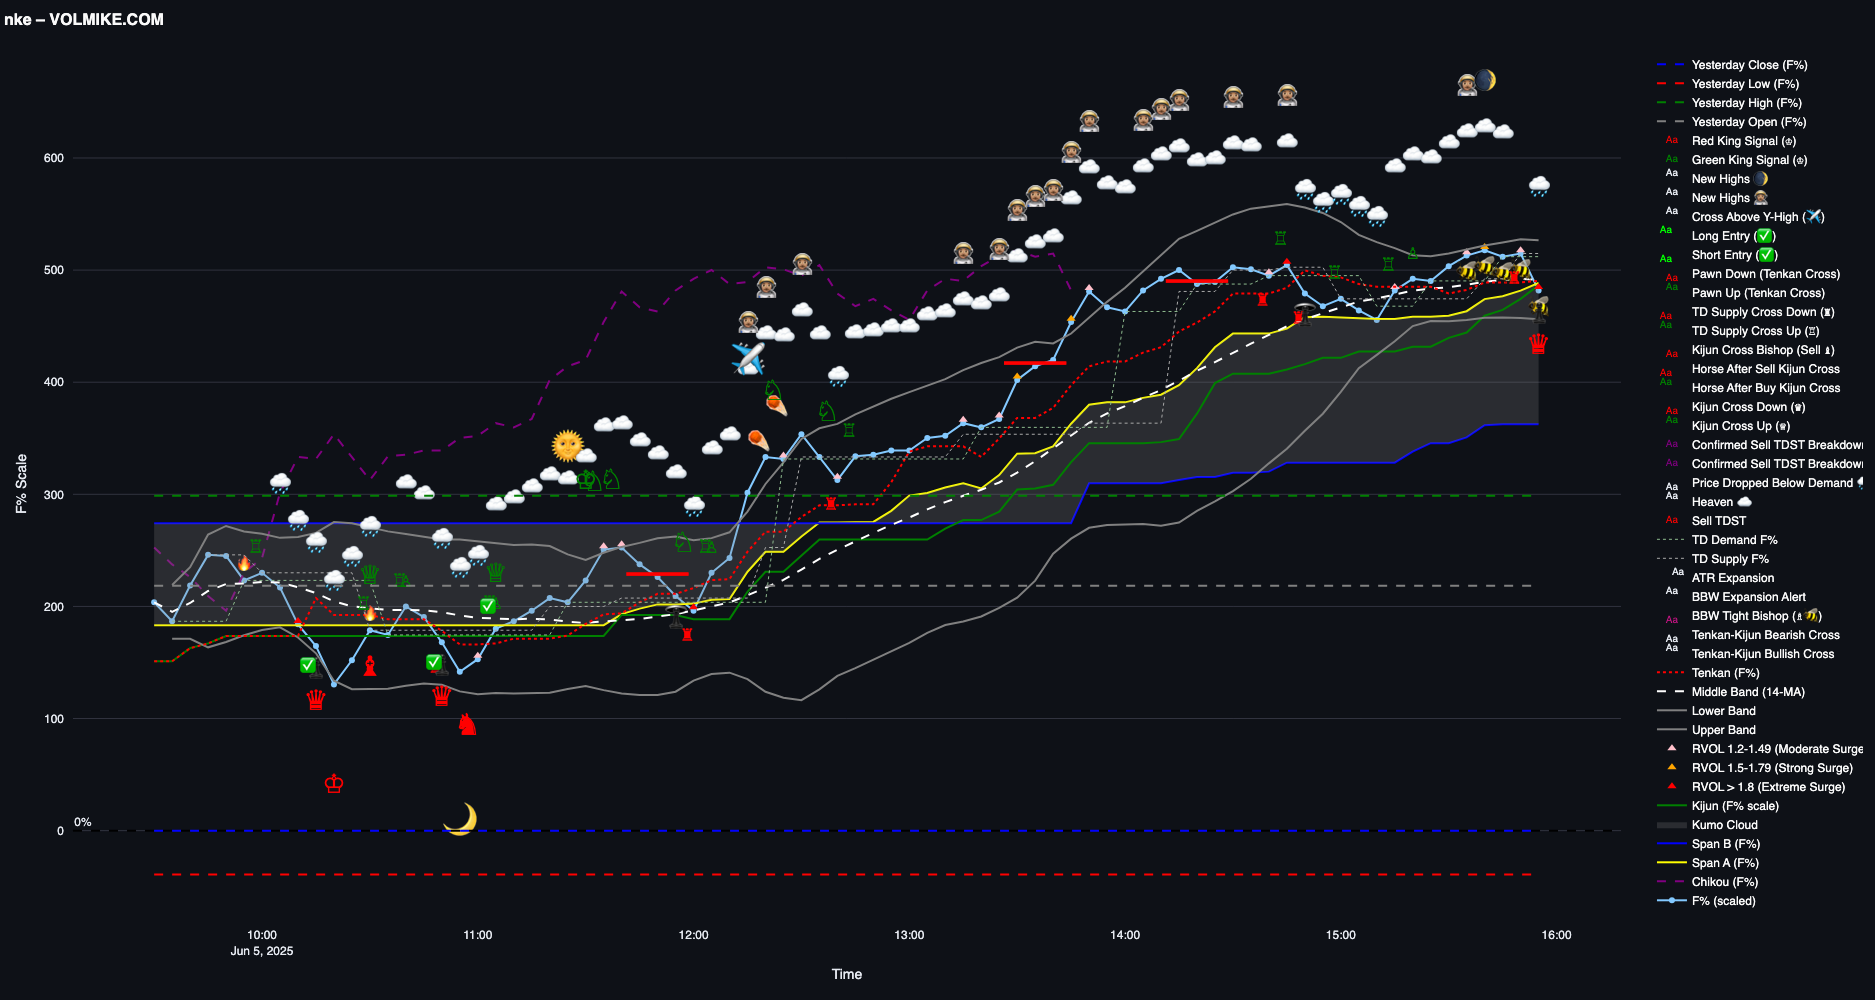
Your Mike Dashboard: Deciphering the Market's Signals
Discover the intuitive visual language of the Mike Dashboard. Learn how our proprietary emojis summarize critical market signals and pave the way for high-probability 'Marengo' trade setups.
Your Mike Dashboard: Deciphering the Market's Signals
Welcome to your Mike Dashboard, your at-a-glance guide to the heart of VOLMIKE.COM analysis. In our system, key market conditions and critical signals are often summarized by intuitive emojis. These aren't just decorative; they're powerful visual cues, each representing a specific state or catalyst identified by our proprietary Mike indicator and complementary tools.
Think of them as the market's own "weather report," distilled into a universal visual language. Each emoji tells a concise story about the underlying volatility, momentum, and potential for a "Marengo" opportunity.
Below, we introduce the core emojis you'll encounter on your Mike Dashboard and within our "Opus" cards. To understand the full power of each signal, click on its name to explore its dedicated page, where we detail its calculation, interpretation, and strategic significance.
Understanding Your Mike Dashboard Emojis:
- 🐝 The Horse: This symbol indicates a period of sustained, high Relative Volume. Specifically, the "Horse" is plotted when Relative Volume is consistently greater than 1.2 (or 1.5, or 1.8) for a rolling window of 5 bars. This signifies that market participation is high and consistent. If a "Marengo" signal occurs shortly after a "Horse" (a "Scout Marengo"), it suggests a powerful price move is backed by active and engaged market interest, increasing its conviction.
- Click to learn more about The Horse (Bees).
- 🟣 The Bishop: This powerful signal represents a specific alignment of market structure and volatility. "Bishops" often emerge at critical "ignition points" for price action, indicating a high-probability moment for a decisive directional move. They are key confirmations within many of our setups.
- Click to learn more about The Bishop.
- 🌙 The Moon Phases: These emojis directly represent Demark-Buy-TDST or Demark-Sell-TDST setups. These signals are designed to highlight potential exhaustion points or significant turns in price momentum, giving us an early indication of possible shifts in trend.
- Click to learn more about The Moon Phases (Demark-Buy-TDST/Sell-TDST).
- 🔴 The Red Flag: This distinct symbol serves as a warning or divergence signal. It often indicates underlying weakness in a setup or a condition that requires extra caution and potentially suggests avoiding a trade or tightening risk management.
- Click to learn more about The Red Flag.
- ⚪ The White Dot / Plot: This represents the Mike line itself. Its precise position relative to other indicators, and its trajectory, provides a direct read on the daily percentage change velocity. It is the visual representation of our core "Volatility Mike" indicator.
- Click to learn more about The Mike Line.
- 📊 The Price Bars: While not an emoji, the candlestick bars (often displayed in green for upward movement and red for downward movement relative to the bar's open) represent the raw price action. They provide the fundamental context and visual confirmation for all the indicator overlays and signals discussed.
- Click to learn more about Price Bars & Candlestick Interpretation.
This dashboard is designed for rapid interpretation, allowing you to quickly grasp the prevailing market conditions and identify potential setups at a glance. As you delve deeper into each emoji's dedicated page, you'll gain the nuanced understanding needed to effectively leverage these powerful signals in your trading.